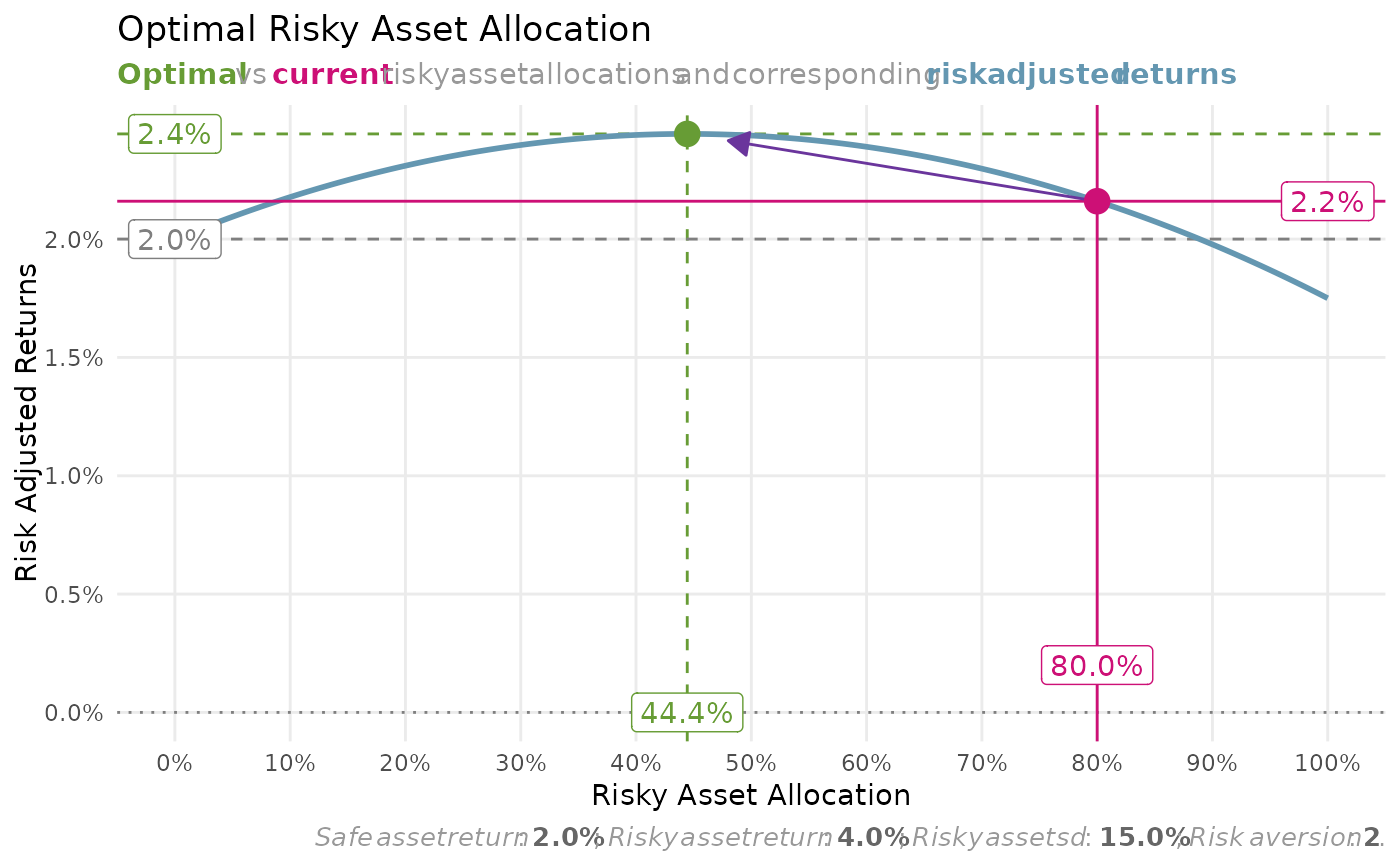
Plots the risk adjusted returns for portfolios of various allocations to the risky asset.
Usage
plot_risk_adjusted_returns(
  safe_asset_return,
  risky_asset_return_mean,
  risky_asset_return_sd,
  risk_aversion = 2,
  current_risky_asset_allocation = NULL
)
Arguments
- safe_asset_return
A numeric. The expected yearly return of the safe asset.
- risky_asset_return_mean
A numeric. The expected (average) yearly return of the risky asset.
- risky_asset_return_sd
A numeric. The standard deviation of the yearly returns of the risky asset.
- risk_aversion
A numeric. The risk aversion coefficient.
- current_risky_asset_allocation
A numeric. The current allocation to the risky asset. For comparison with the optimal allocation.
Value
A ggplot2::ggplot() object.