Plotting changes to the purchasing power over time
Source:R/plot_purchasing_power.R
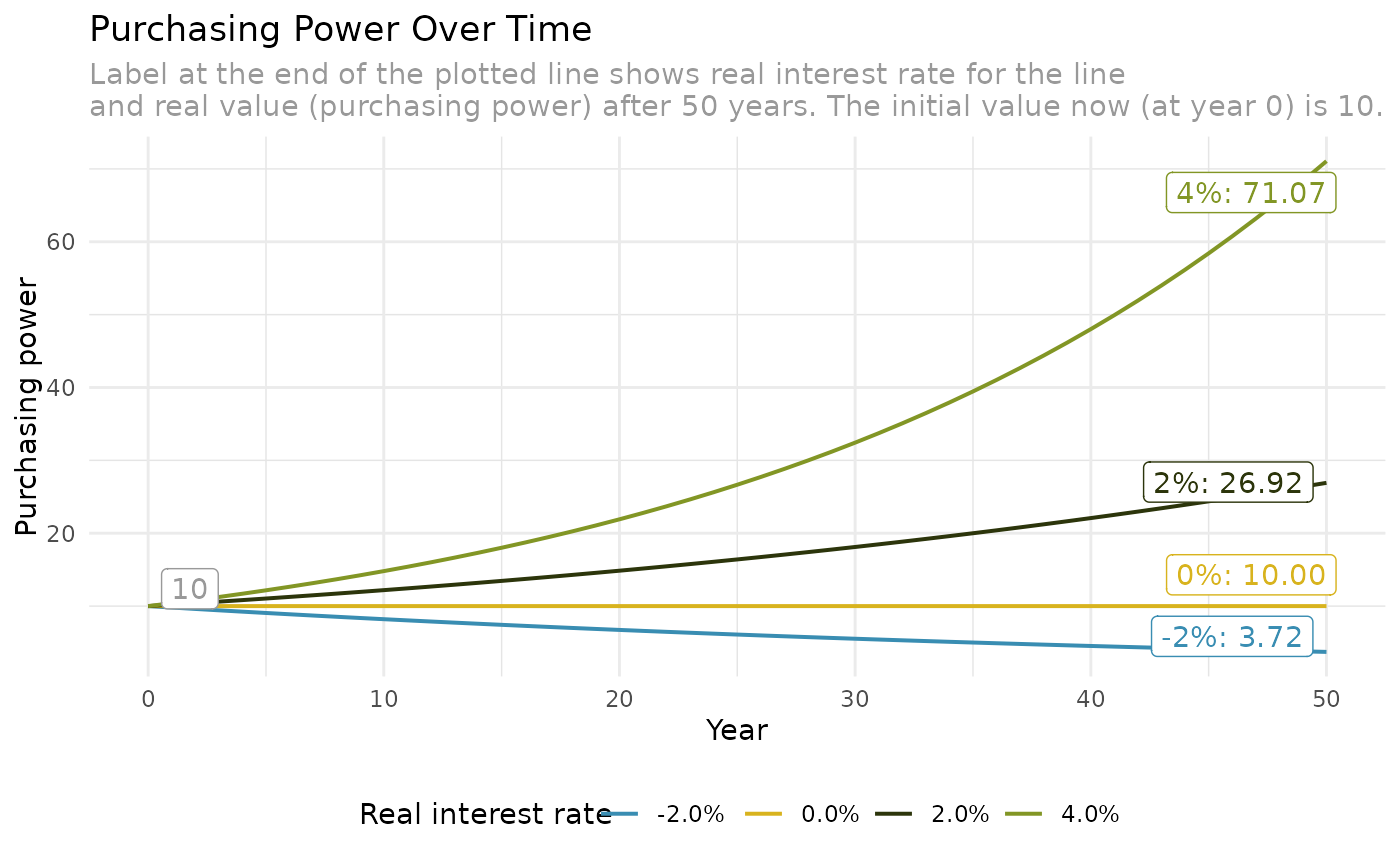
plot_purchasing_power.RdPlots the effect of real interest rates (positive or negative) on the purchasing power of savings over the span of 50 years (default).
Usage
plot_purchasing_power(
  x,
  real_interest_rate,
  years = 50,
  legend_title = "Real interest rate",
  seed = NA
)Value
A ggplot2::ggplot() object.
Examples
plot_purchasing_power(
  x = 10,
  real_interest_rate = seq(-0.02, 0.04, by = 0.02)
)
#> Ignoring unknown labels:
#> • linetype : "Real interest rate"