Plotting the results of Gompertz model calibration for joint survival
Source:R/calc_gompertz.R
plot_joint_survival.RdPlotting the results of Gompertz model calibration for joint survival
Arguments
- params
A list returned by
calc_gompertz_joint_parameters()function.- include_gompertz
A logical. Should the Gompertz survival curve be included in the plot?
Value
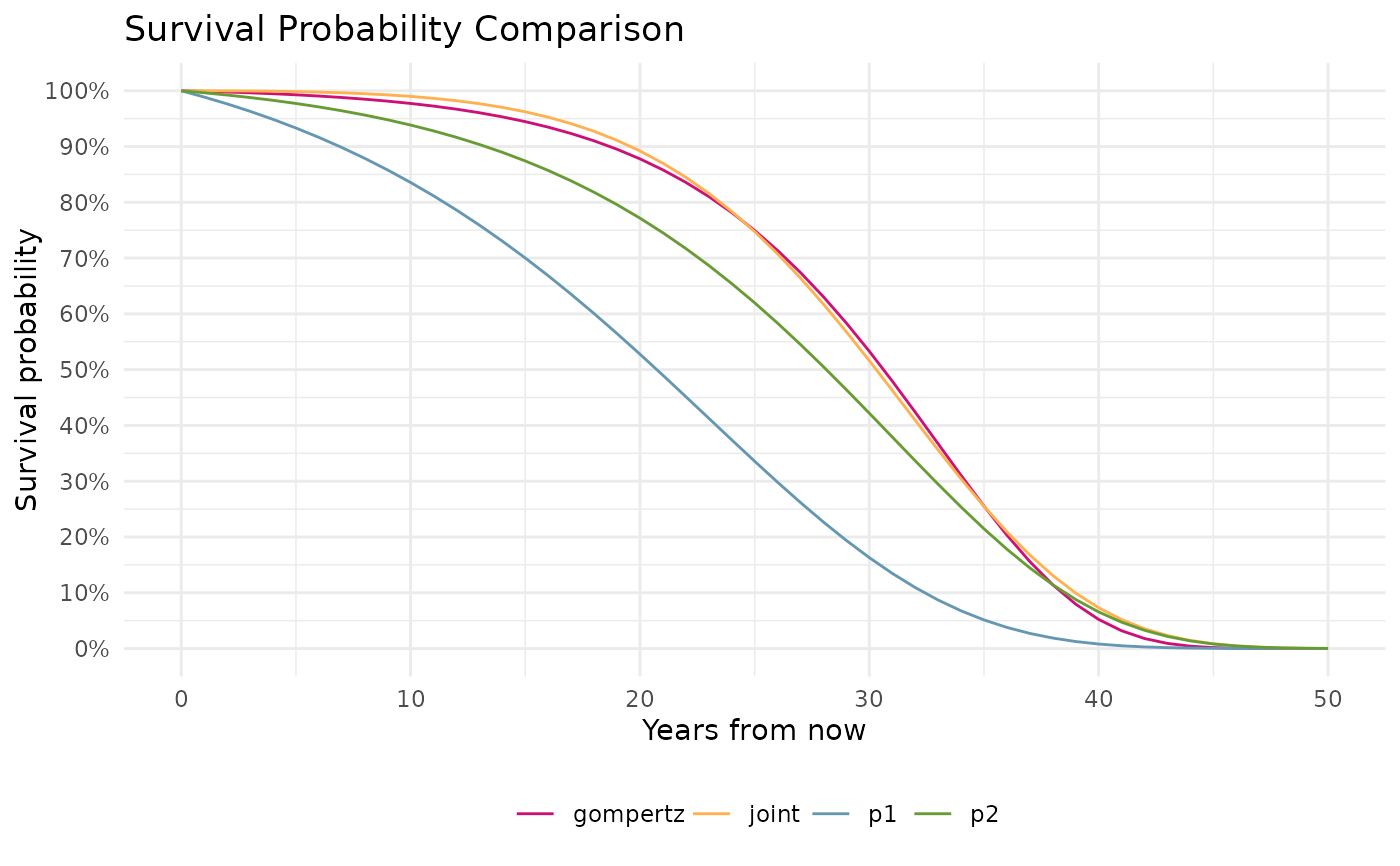
A ggplot2::ggplot() object showing the survival probabilities
for two individuals and their joint survival probability.
Examples
params <- calc_gompertz_joint_parameters(
  p1 = list(
    age        = 65,
    mode       = 88,
    dispersion = 10.65
  ),
  p2 = list(
    age        = 60,
    mode       = 91,
    dispersion = 8.88
  ),
  max_age = 110
)

plot_joint_survival(params = params, include_gompertz = TRUE)