Plotting the results of Gompertz model calibration
Source:R/calc_gompertz.R
plot_gompertz_calibration.RdPlotting the results of Gompertz model calibration
Arguments
- params
A list returned by
calc_gompertz_parameters()function.- mode
A numeric. The mode of the Gompertz model.
- dispersion
A numeric. The dispersion of the Gompertz model.
- max_age
A numeric. The maximum age of the Gompertz model.
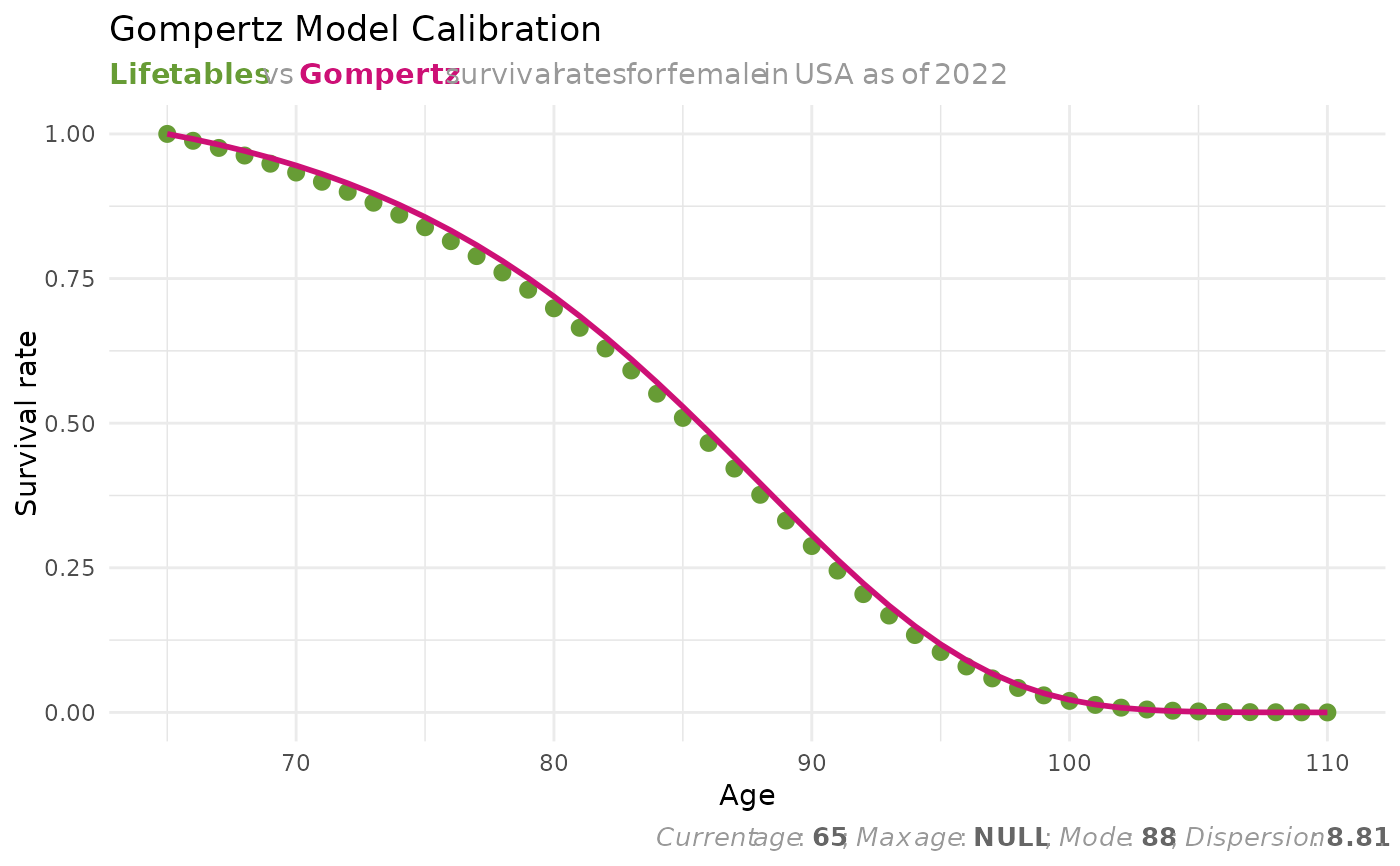
Value
A ggplot2::ggplot() object showing the comparison between
actual survival rates from life tables and the fitted Gompertz model.
Examples
mortality_rates <-
  dplyr::filter(
    life_tables,
    country == "USA" &
    sex     == "female" &
    year    == 2022
  )

params <- calc_gompertz_parameters(
  mortality_rates = mortality_rates,
  current_age     = 65
)

plot_gompertz_calibration(params = params)