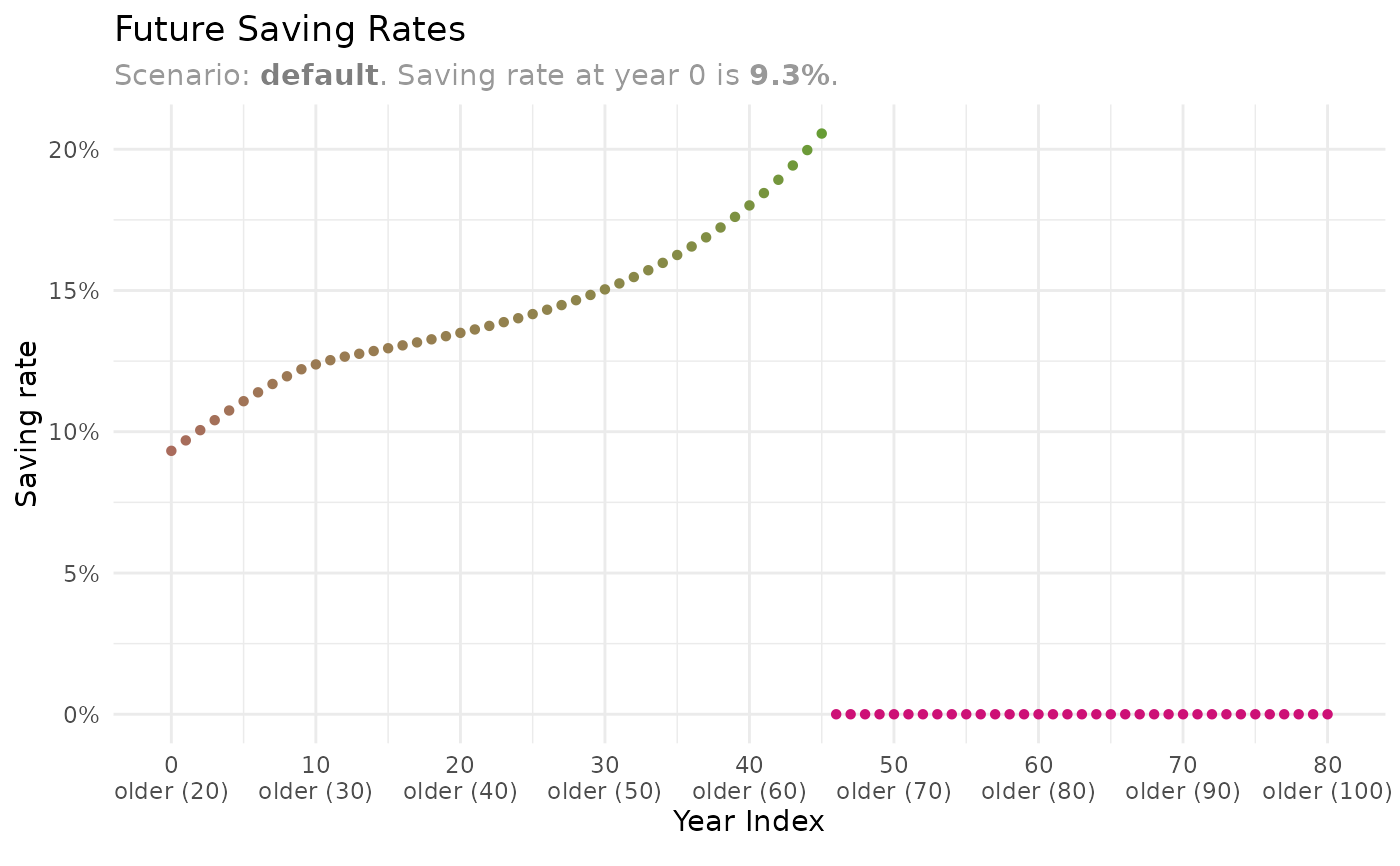
This function plots the future saving rates from a scenario object.
Arguments
- scenario
A
tibblewith nested columns - the result ofsimulate_scenario(). Data for a single scenario.- aggregation_function
A function used to aggregate the saving rates for multiple Monte Carlo samples. Default is
median. IfNULL, no aggregation is performed.- y_limits
A numeric vector of two values. Y-axis limits.
Value
A ggplot2::ggplot() object.
Examples
older_member <- HouseholdMember$new(
  name       = "older",
  birth_date = "2000-02-15",
  mode       = 80,
  dispersion = 10
)
household <- Household$new()
household$add_member(older_member)

household$expected_income <- list(
  "income" = c(
    "members$older$age <= 65 ~ 10000 * 12"
  )
)
household$expected_spending <- list(
  "spending" = c(
    "TRUE ~ 5000 * 12"
  )
)

portfolio <- create_portfolio_template()
portfolio$accounts$taxable <- c(10000, 30000)
portfolio$weights$human_capital <- c(0.2, 0.8)
portfolio$weights$liabilities <- c(0.1, 0.9)
portfolio <-
  portfolio |>
  calc_effective_tax_rate(
    tax_rate_ltcg            = 0.20,
    tax_rate_ordinary_income = 0.40
  )

scenario <-
  simulate_scenario(
   household    = household,
   portfolio    = portfolio,
   current_date = "2020-07-15"
  )
#> Warning: no DISPLAY variable so Tk is not available
#>
#> ── Simulating scenario: default
#> ℹ Current date: 2020-07-15
#> ! Caching is NOT enabled.
#> → Simulating scenario based on expected returns (sample_id == 0)

plot_future_saving_rates(scenario)